In OpenCV, We use the cv2.calcHist() function to compute the histogram of an image. We can use this function to compute the histogram of a region of the image. To compute a histogram of a region in the image first we define a mask. The white color in the...
In OpenCV, We use the cv2.calcHist() function to compute the histogram of an image. We can use this function to compute the histogram of a region of the image. To compute a histogram of a region in the image first we define a mask. The white color in the maskis for regions to examine in the original input image and the black color in the mask image is for regions to ignore. Now we calculate the histogram passing this mask as a parameter to the function.
To compute and plot the histograms of a region of the image, one could follow the steps given below −
Import the required libraries OpenCV, NumPy and matplotlib. Make sure you h**e already installed them.
Read the input image using cv2.imread() method. Specify the full path of the image.
Define a mask for our image. The black color in the mask image is for regions to ignore and white for regions to examine in the original input image.
Split the different channels (blue, green and red) of the input image using cv2.split() function.
Compute the histograms of different channels of the input image using the above defined mask. Plot the histogram of different colors of the input image.
hist = cv2.calcHist([channel], [0], mask, [256], [0, 256])
To visualize the masked region of the input image perform cv2.bitwise_and() operation on input image with mask image. It creates a masked region of input image.
Let's look at some examples for a clear understanding about the question.
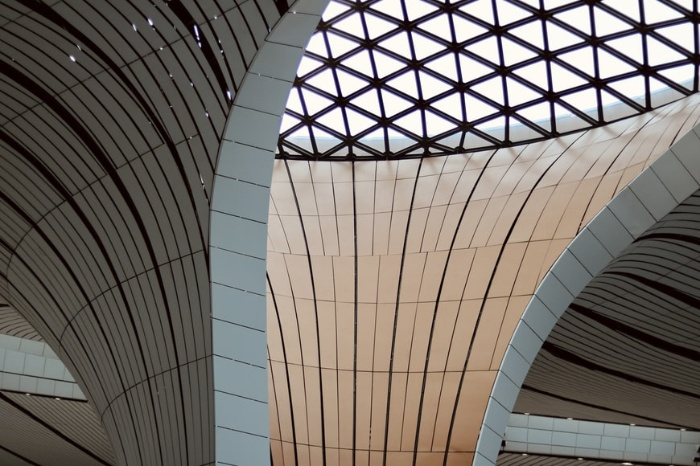
We use the following image as an input file in the example below.

In this example, we compute the histogram of a rectangular region of the input image and plot the histogram.
It produces the following output windows when you run the above Python program −

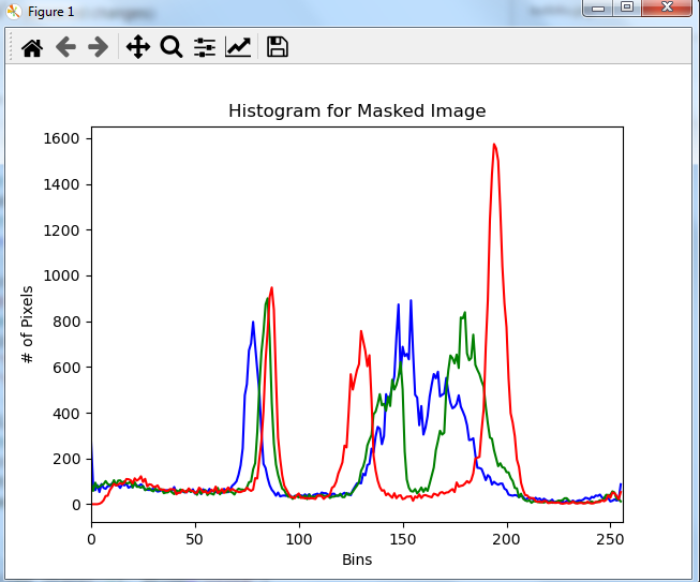
The above output image shows the histogram of a rectangular region in the input image.


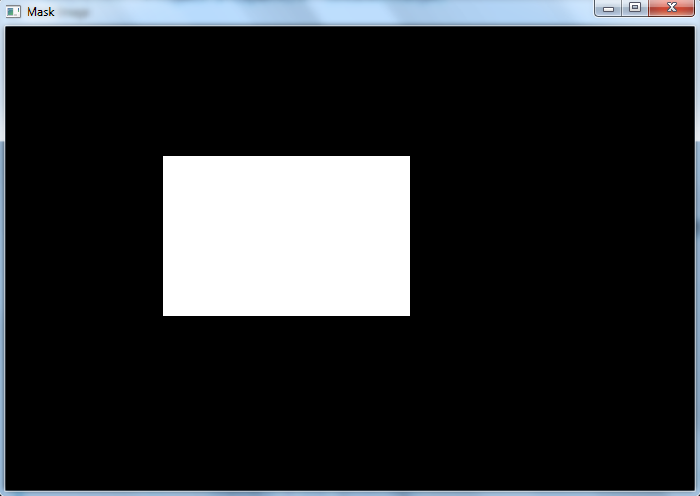
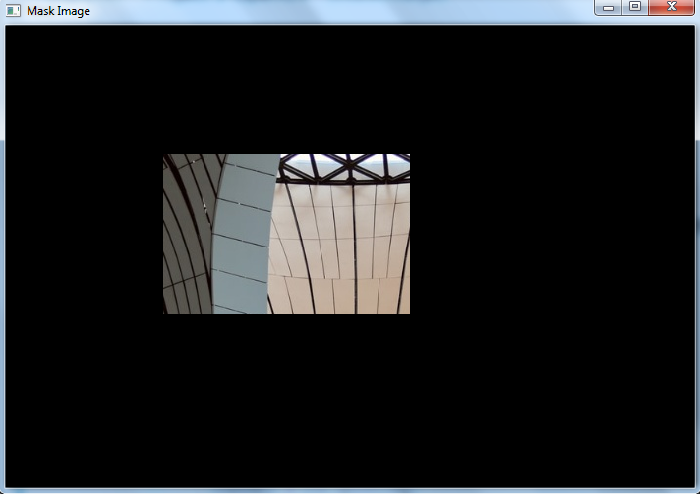
The above two output images are the mask and rectangular regions of the input image. The histogram is computed only for this masked region.